


The IA Intelligence Platform

Two decades of industry data,
ready to explore.

Brings the Investment Management Survey and ISA Barometer together. Interactive charts, the report archive, an assistant that cites its sources, and builders for dashboards and decks.

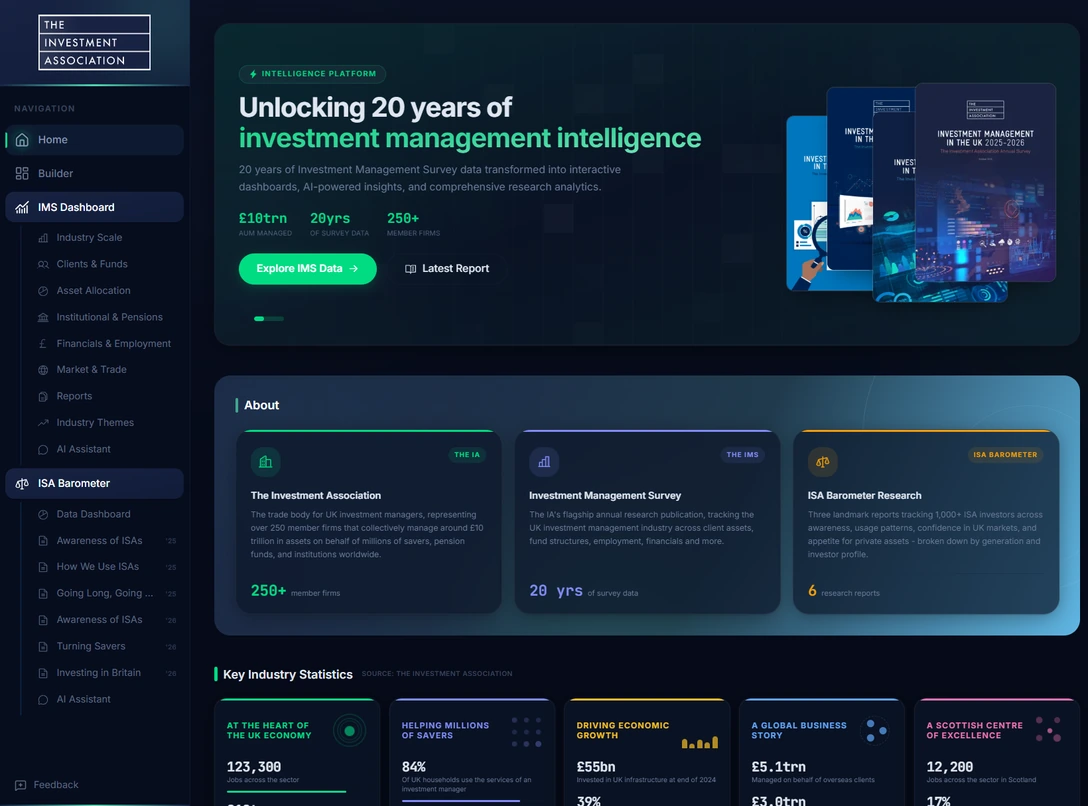
The IA Intelligence Platform home page, headed Unlocking 20 years of investment management intelligence, with report covers, an overview of the IA, the survey and the ISA Barometer, and key industry statistics
managed by IA members in the UK
£11.1trn
member firms represented
250+
of Investment Management Survey data
20 years
of UK households use investment managers
84%

What's inside

The IA's research, rebuilt to work with.

Explore the numbers behind the publications rather than reading around them. One record is the industry. The other is the household.

01Investment Management Survey

Twenty years of the survey, as interactive charts.

Every chapter of the IMS is a dashboard: industry scale, clients and funds, asset allocation, institutional and pensions, financials and employment, and market and trade.

  • Filter every chart to any period from 2005 to 2025
  • Three-year model projections, clearly marked as forecasts
  • Ask a question about any chart and get an answer grounded in the survey
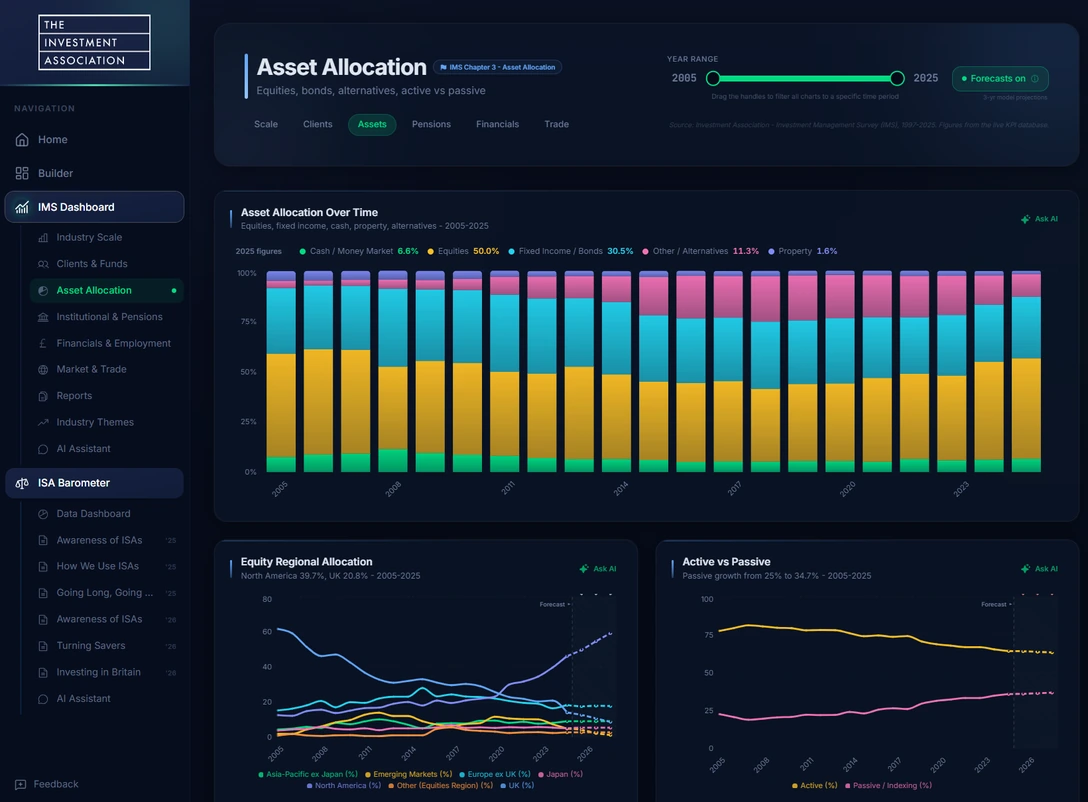
The Asset Allocation dashboard beside the platform navigation: asset mix since 2005, equity regional allocation and active versus passive charts

02ISA Barometer

Saver research with a page reference behind every figure.

The ISA Barometer papers, produced with Opinium, collected into one dashboard. Read the headlines, then explore each theme chart by chart and compare survey waves.

  • 126 charts drawn from six research papers
  • Change since the previous wave shown alongside the figures
  • Each figure links to the page of the paper it comes from
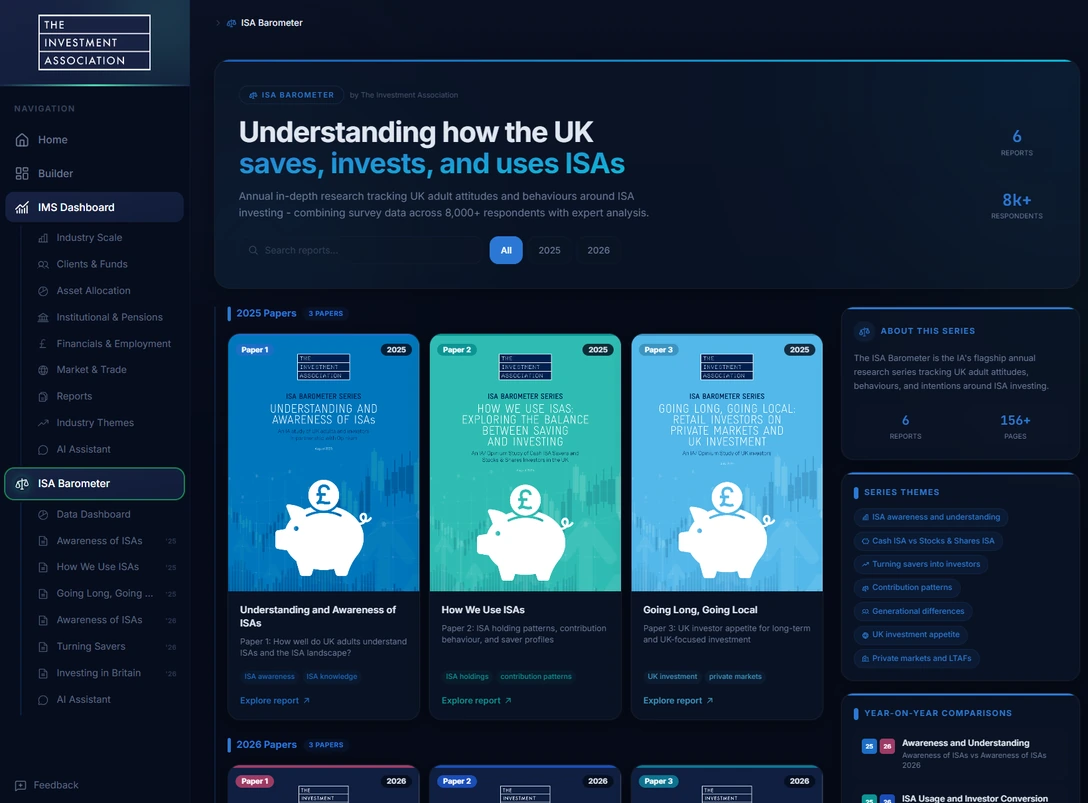
The ISA Barometer series page, with the 2025 papers on awareness of ISAs, how people use them, and going long, going local

03Reports and research assistant

The full report archive, with an assistant that cites its sources.

Read any edition of the Investment Management Survey in the browser. Ask questions about a single report or across all of them, and open the page each answer is drawn from.

  • Every IMS edition in one library
  • Answers include page citations that open the source PDF
  • Scope the assistant to one report or the whole archive
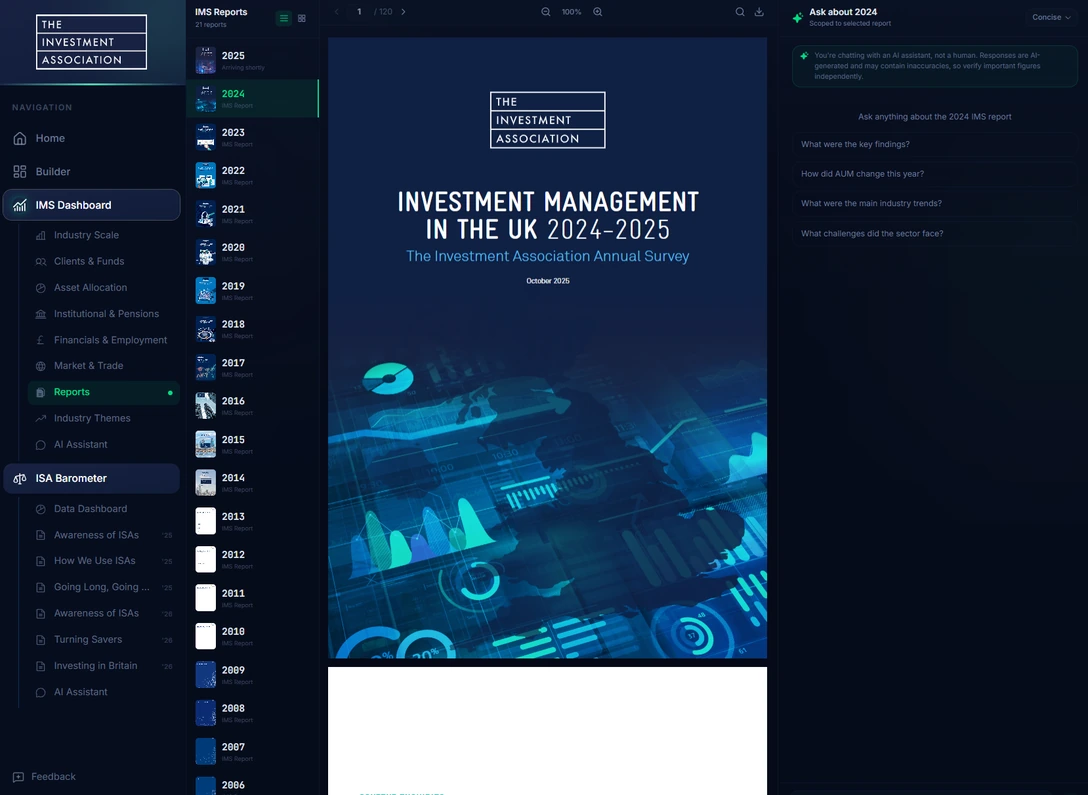
The IMS report library, with the 2024 report open beside an assistant scoped to that report

Builder

Turn the data into board-ready material.

Two builders, one hub. Both draw on the same live IMS and ISA Barometer figures, so nothing is retyped or recalculated on the way to your meeting.

Dashboard builder

Arrange live charts into a board of your own.

Pick charts and stats straight off the IMS and ISA Barometer dashboards and lay them out the way your audience needs them. Same figures, same year filter, your layout and your logo.

  • Add any chart or stat from the IMS and ISA Barometer
  • Resize and arrange widgets, and filter every chart by year
  • Share a read-only link, or present it fullscreen
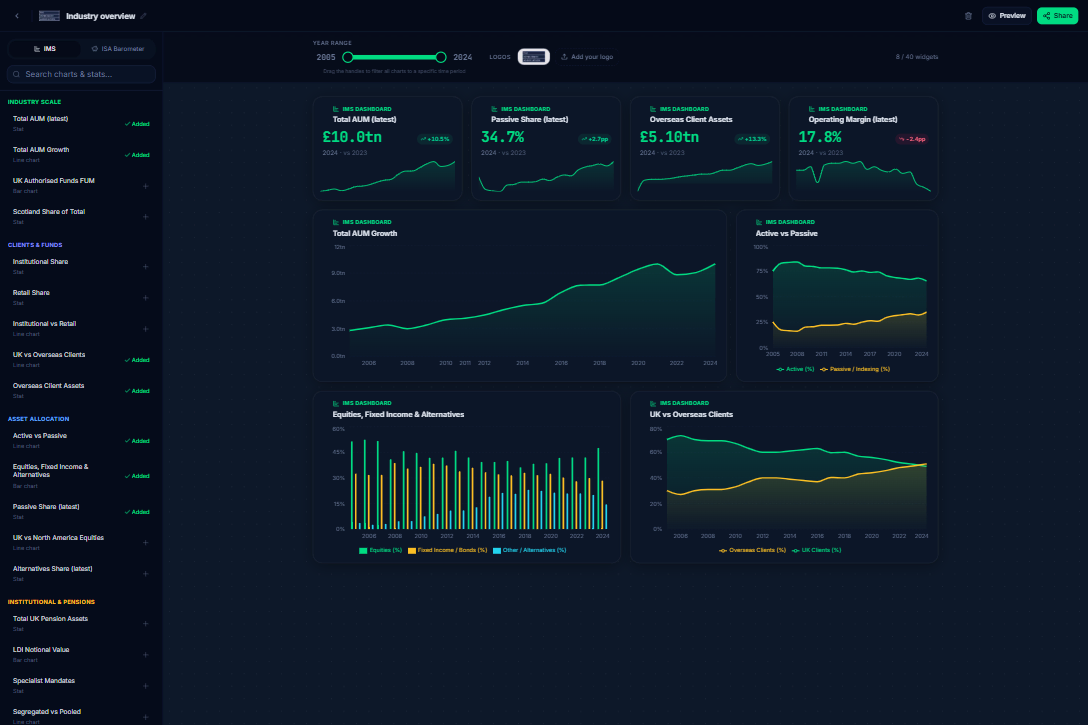
The dashboard builder: a catalog of IMS charts and stats beside a custom dashboard of AUM, passive share, overseas client and operating margin widgets

Presentation builder

Describe the deck you need, and AI drafts it from the data.

Ask for a deck in plain English and the AI builder writes narrated slides around the survey. Commentary is drafted for you, while the figures in every chart come live from the IMS dashboard.

  • Edit any slide, reorder the deck and choose a theme
  • Charts pull their figures live, never retyped
  • Ready-made IA decks to present as they are
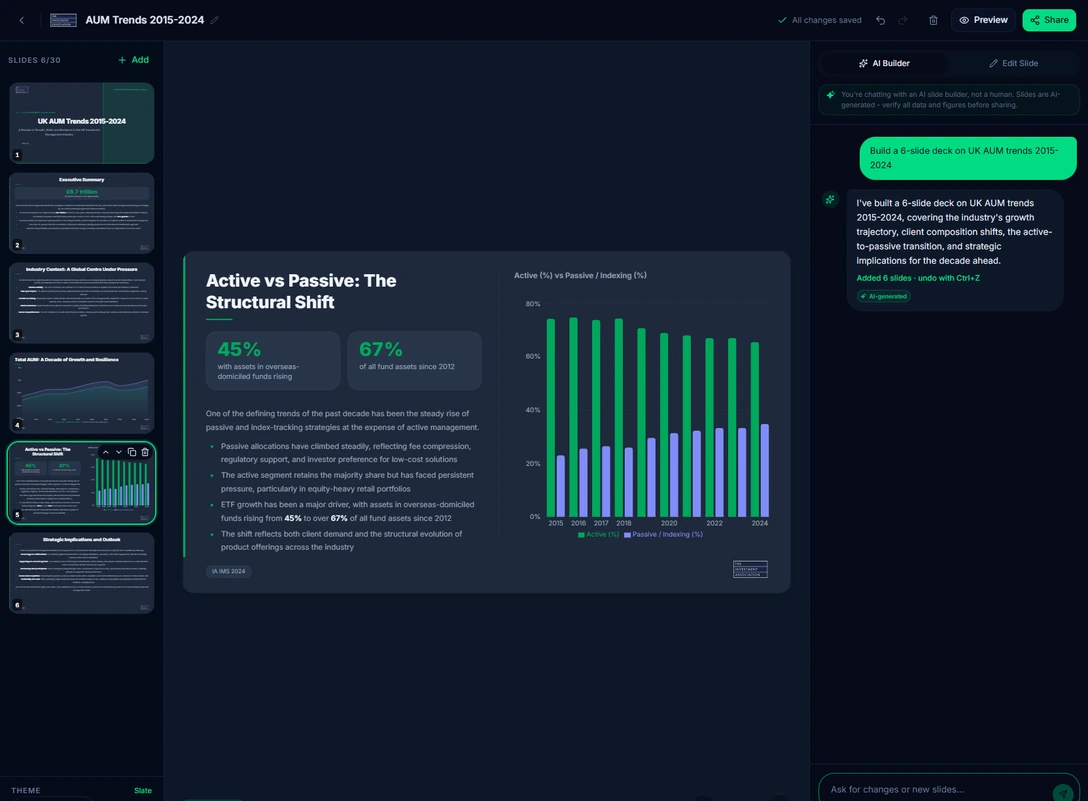
The presentation builder: an AUM Trends 2015-2024 deck, with an active versus passive slide and the AI builder that drafted it

Access

One sign-in, no new password.

You sign in on theia.org and come straight back here. The IA Intelligence Platform never sees your password.